Beyond the To-Do List: From Execution to Analysis
Managing your daily work is critical, and that’s the job ofWorkviews. They provide the lists, boards, and timelines you need to interact with and progress your individual 🧊 Objects.
But to truly improve your business, you need to step back and see the big picture. You need to identify trends, spot bottlenecks, and measure performance. This requires a different tool—not for doing the work, but for analyzing it. That tool is the Dashboard.
Workview vs. Dashboard: The Critical Difference
Understanding the distinction between aWorkview and a Dashboard is key to using Luklak effectively.
Workview (The Workshop)
Purpose: Execution. A Workview is where you actively work on
Focus: A list of individual work items.
🧊 Objects—updating fields, dragging cards, and moving work forward.Focus: A list of individual work items.
Dashboard (The Control Tower)
Purpose: Analysis. A Dashboard aggregates, calculates, and visualizes data from many
Focus: Summaries and trends of work items.
🧊 Objects to provide insights.Focus: Summaries and trends of work items.
The Power of a Unified Data Source
In traditional software, building a dashboard that combines data from different departments (like Sales and Operations) requires a complex, costly, and slow ETL (Extract, Transform, Load) process. Because all data in Luklak is built on the🧊 Universal Object, our dashboards can instantly query and aggregate data from any Function or Space across the entire system. Your “Sales” data and “Project” data already speak the same language. This allows you to build truly cross-functional dashboards in minutes, not months.
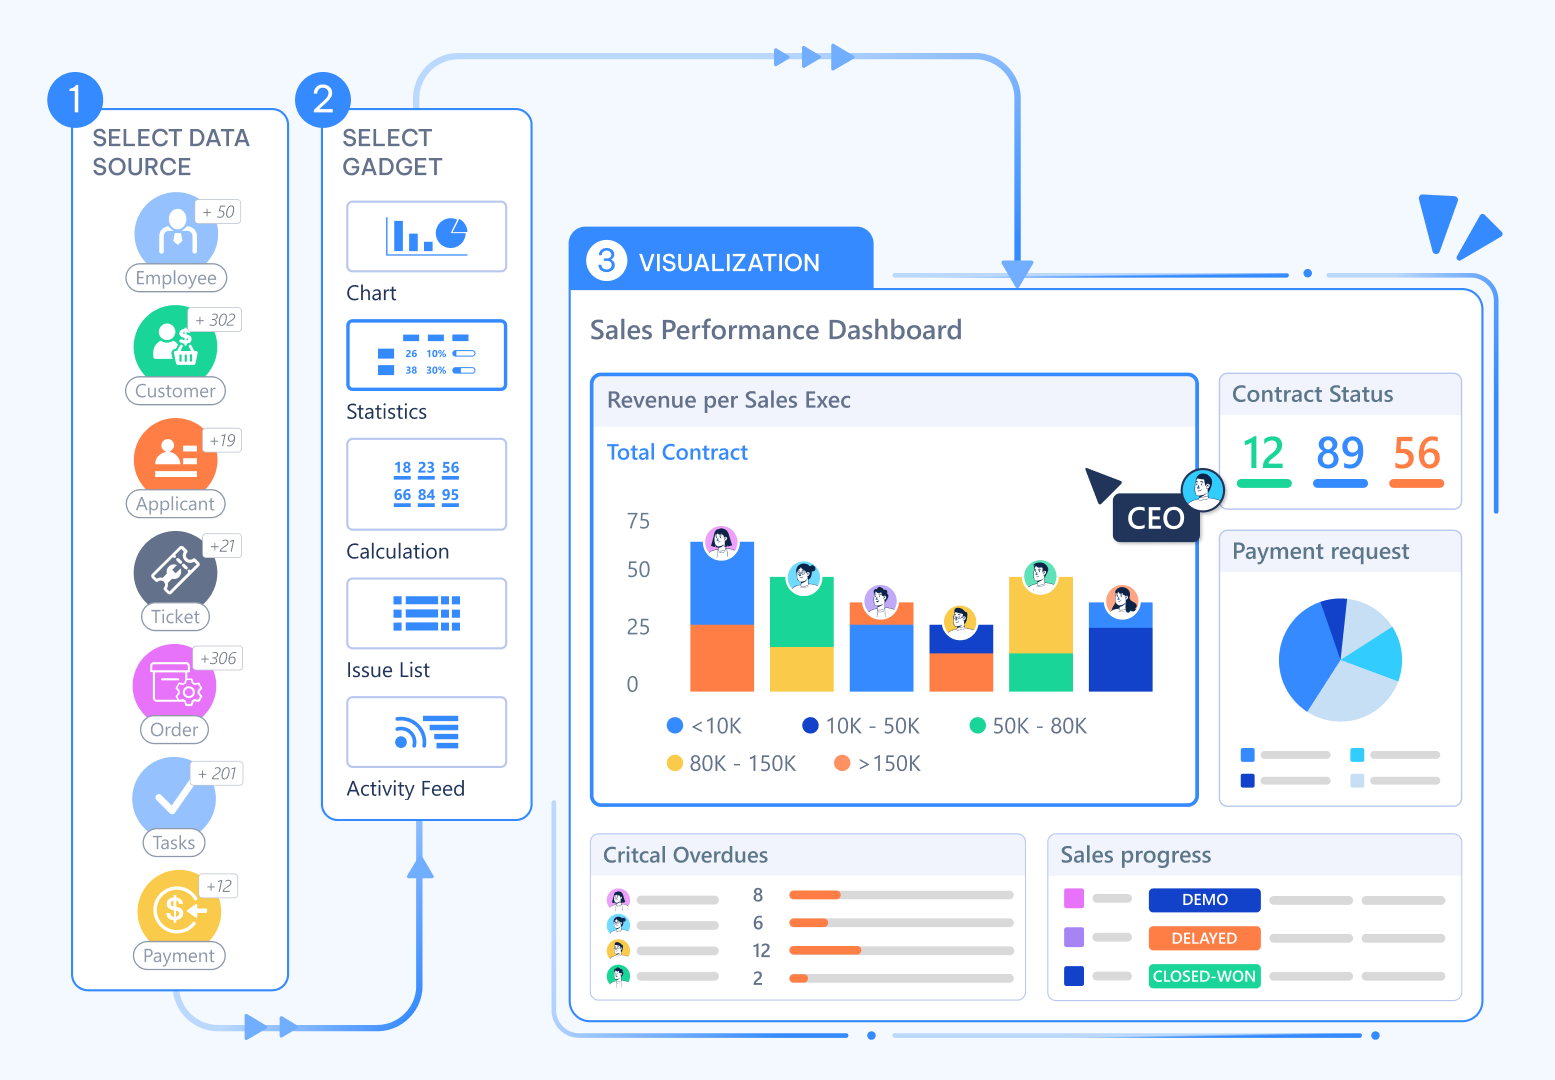
A Glimpse of the Possibilities
You build your dashboards by adding and arranging various gadgets, each designed to present data in a specific way. These include powerful tools like:- Charts (Pie, Bar, Stacked Bar)
- Counters & Formulas
- 1D & 2D Statistics Tables
- Live Object Lists