> ## Documentation Index
> Fetch the complete documentation index at: https://docs.luklak.com/llms.txt
> Use this file to discover all available pages before exploring further.
# Dashboards: Visualizing Your Business Insights
> An introduction to Dashboards in Luklak, explaining their role in data analysis and how they differ from Workviews, which are used for daily execution.
## Beyond the To-Do List: From Execution to Analysis
Managing your daily work is critical, and that's the job of `Workviews`. They provide the lists, boards, and timelines you need to interact with and progress your individual `🧊 Objects`.
But to truly improve your business, you need to step back and see the big picture. You need to identify trends, spot bottlenecks, and measure performance. This requires a different tool—not for *doing* the work, but for *analyzing* it. That tool is the **Dashboard**.
 ## Workview vs. Dashboard: The Critical Difference
Understanding the distinction between a `Workview` and a `Dashboard` is key to using Luklak effectively.
**Purpose:** **Execution.** A Workview is where you actively work on `🧊 Objects`—updating fields, dragging cards, and moving work forward.
## Workview vs. Dashboard: The Critical Difference
Understanding the distinction between a `Workview` and a `Dashboard` is key to using Luklak effectively.
**Purpose:** **Execution.** A Workview is where you actively work on `🧊 Objects`—updating fields, dragging cards, and moving work forward.
**Focus:** A list of **individual work items**.
**Purpose:** **Analysis.** A Dashboard aggregates, calculates, and visualizes data from many `🧊 Objects` to provide insights.
**Focus:** **Summaries and trends** of work items.
\[Image Placeholder: A side-by-side comparison. On the left, a Kanban Workview showing individual task cards. On the right, a Dashboard showing a pie chart, a bar chart, and a counter gadget summarizing the data from that same Kanban board.]
## The Power of a Unified Data Source
In traditional software, building a dashboard that combines data from different departments (like Sales and Operations) requires a complex, costly, and slow ETL (Extract, Transform, Load) process.
Because all data in Luklak is built on the `🧊 Universal Object`, our dashboards can instantly query and aggregate data from any `Function` or `Space` across the entire system. Your "Sales" data and "Project" data already speak the same language. This allows you to build truly cross-functional dashboards in minutes, not months.
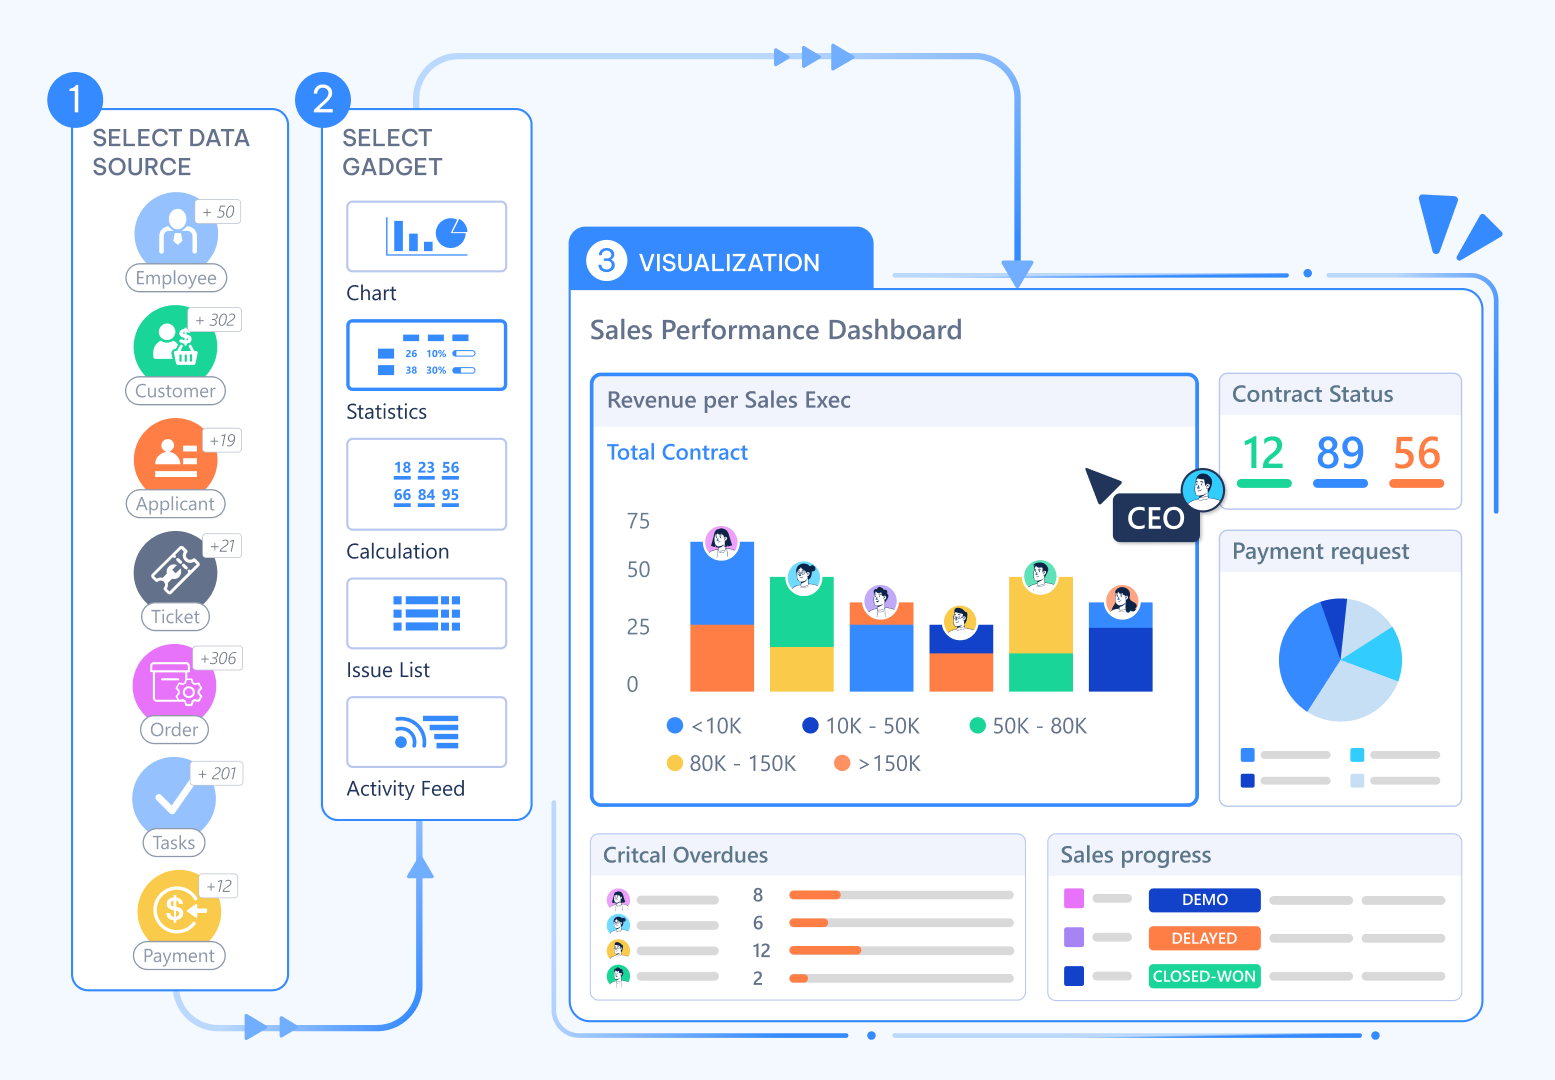
## A Glimpse of the Possibilities
You build your dashboards by adding and arranging various **gadgets**, each designed to present data in a specific way. These include powerful tools like:
* **Charts** (Pie, Bar, Stacked Bar)
* **Counters & Formulas**
* **1D & 2D Statistics Tables**
* **Live Object Lists**
## What's Next?
You now understand the strategic role of Dashboards. The next step is to explore the building blocks you'll use to create your own insightful reports.
* [**Explore the full library: A Guide to Dashboard Gadgets**](/en/02-platform/platform-overview/dashboards/dashboard-gadgets)
* [**Learn the step-by-step process: Building Your First Dashboard**](/en/02-platform/platform-overview/dashboards/building-dashboards)
* [**Make your dashboards dynamic: Using Interactive Dashboards**](/en/02-platform/platform-overview/dashboards/interactive-dashboards)